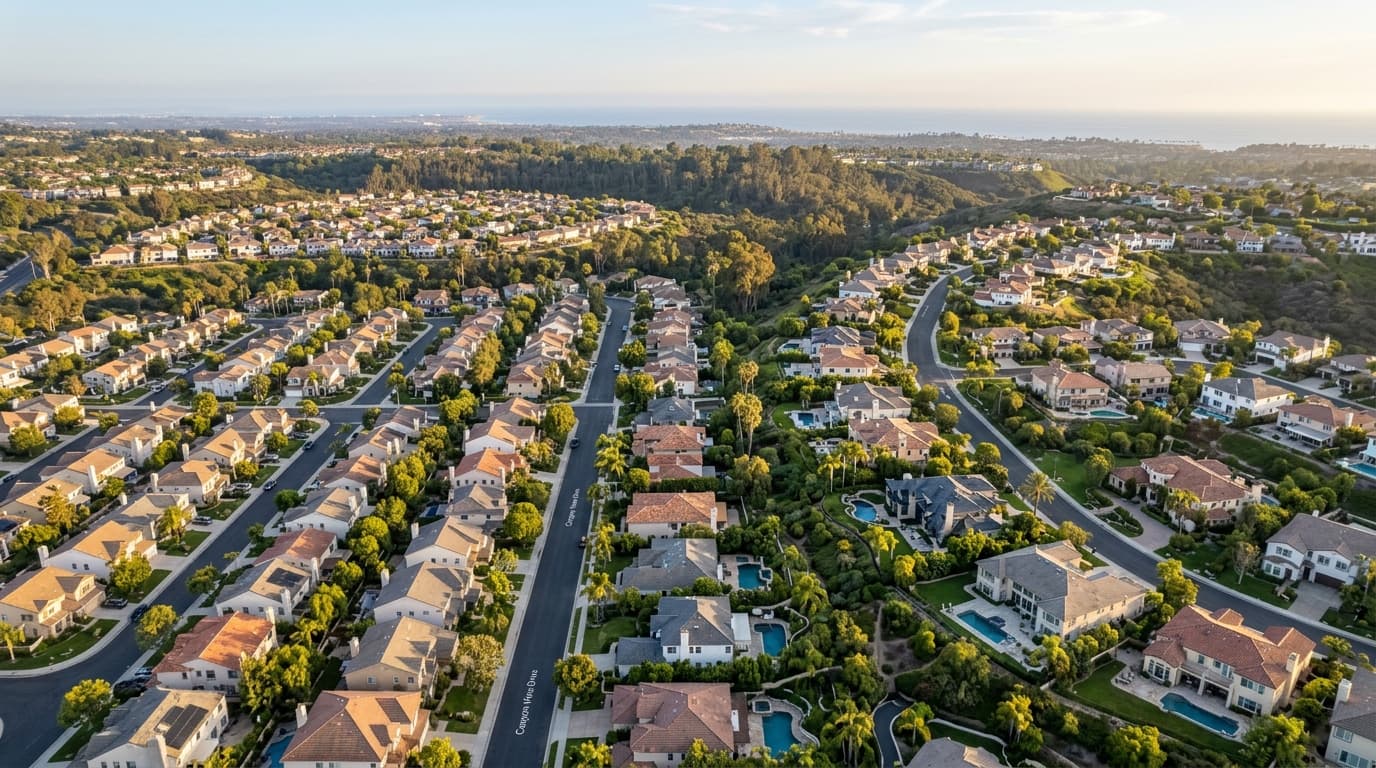
Micro-Market Absorption Rates Across Orange County
Countywide averages hide what is happening street by street. Learn how absorption rates reveal pricing power in Orange County micro-markets and how sellers can use them.
A headline that says the Orange County market is "balanced" tells a homeowner almost nothing about their own street. A cul-de-sac in one city can behave like a seller's market while a similar home a few miles away sits for weeks. If you are planning a significant sale, the number that matters is the absorption rate of your specific micro-market.
What Absorption Rate Means
Absorption rate measures how quickly available homes sell in a defined area over a defined period. It is usually expressed in one of two ways:
- Months of supply: how long it would take to sell all current active listings at the recent pace of sales.
- Percent absorbed: the share of active inventory that went under contract during a period.
Lower months of supply generally signals buyer competition and stronger seller leverage. Higher months of supply generally signals more choice for buyers and more pricing pressure on sellers. Where the lines fall between those conditions is a matter of judgment, so rely on trend direction in your own segment rather than a single universal threshold.
Why Micro-Markets Matter More Than County Averages
Orange County is really a collection of small markets. A micro-market can be defined by several features that buyers actually shop by:
- Home type: detached single-family, townhome, condominium, or small multi-family.
- Lot and view characteristics: hillside, flat lot, large lot, or view parcels.
- Size and price band: a luxury estate and a starter bungalow compete with entirely different buyer pools.
- Commute geography: proximity to freeways, job centers, and transit.
Blending these together produces an average that fits almost no one. A seller of a larger-lot home in Cowan Heights, for example, should care about similar properties in that segment, not condo activity elsewhere.
How to Read the Data You Can Access
You do not need proprietary tools to start. Ask your broker to pull CRMLS data for your segment, then review these indicators together rather than any single one:
- Months of supply over the trailing three, six, and twelve months, to see direction.
- Days on market for homes that sold versus homes that expired or were withdrawn.
- List-to-sale price ratio, which shows how much negotiation room existed.
- Share of listings with price reductions, a signal of whether initial pricing is realistic.
- New listing inflow compared with pending sales.
Look at trends, not snapshots. A segment with falling supply and shrinking price reductions is behaving differently from one where inventory is quietly building, even if both show the same number today.
Turning Absorption Into a Selling Strategy
Absorption data should shape three decisions: price, timing, and method.
On price, a slow-absorbing segment rewards sharp positioning from day one, because stale listings tend to attract lower offers. On timing, a fast-absorbing segment may not require waiting for a seasonal peak. On method, a traditional listing relies on whatever buyers happen to see the property during an open-ended period.
That is why I use a defined 21-Day Controlled Auction window with a reserve price floor for qualifying properties. In my advisory materials, an illustrative modeled comparison shows a traditional listing averaging about 68 days to close versus a 21-day defined sale window, about 47 days faster. These figures are modeled illustrations, not promises, and results vary by property and market.
A Quick Micro-Market Checklist
Before you decide how to sell, confirm that you can answer these:
- Which five to ten recent sales are truly comparable in type, lot, and condition?
- Is inventory in my segment rising, falling, or flat over six months?
- How many comparable homes needed a price cut before selling?
- What buyer pool, local or international, is most likely for this property?
- What is my minimum acceptable outcome after costs?
Your Next Step
If you want your own property measured against its true micro-market rather than a county headline, I invite you to schedule a 20-minute Private Broker Consultation to request a Private Feasibility Analysis. Call or email me directly and we will review your segment, your goals, and the sale methods worth considering.
Antoine Tran | CA DRE #01993930 | (714) 880-9288 | antoine@antoinetran.com
This article is educational and is not legal, tax, or financial advice. Please consult a licensed attorney, CPA, or lender about your specific situation.
Educational content only. Discuss property-specific guidance with a licensed broker, or see how Antoine can help.
Request a Private Feasibility Analysis